Working with deepforest data#
Hi all, welcome to another installment of working with DeepForest. Today we have some great data from Australian Eucalyptus forests. Let’s walk through the steps to get some predictions. The first thing I did was look at the tile in QGIS to get a sense of the resolution (5cm), habitat type and image quality. Then I started with our standard boilerplate DeepForest prediction code from the ‘Getting Started’ page. In each of the code snippets below, I show the entire code used to create the output, which reflects what I’m really doing during debugging, which is trying a set of parameters, viewing the output and re-running.
[ ]:
import cv2
import numpy as np
import rasterio as rio
from matplotlib import pyplot as plt
from rasterio.plot import show

from deepforest import main, utilities, visualize
from deepforest.visualize import plot_results

m = main.deepforest()

m.load_model("weecology/deepforest-tree")
try:
    image = m.predict_tile(
        path="/Users/benweinstein/Downloads/Plot13Ortho.tif",
        patch_size=500,
        patch_overlap=0,
    )
    plot_results(image)
except Exception as e:
    print(e)
/Users/benweinstein/.conda/envs/test/lib/python3.10/site-packages/tqdm/auto.py:21: TqdmWarning: IProgress not found. Please update jupyter and ipywidgets. See https://ipywidgets.readthedocs.io/en/stable/user_install.html
  from .autonotebook import tqdm as notebook_tqdm
Reading config file: /Users/benweinstein/.conda/envs/test/lib/python3.10/site-packages/deepforest/data/deepforest_config.yml
GPU available: False, used: False
TPU available: False, using: 0 TPU cores
HPU available: False, using: 0 HPUs
Model saved to: /Users/benweinstein/.conda/envs/test/lib/python3.10/site-packages/deepforest/data/NEON.pt
Loading pre-built model: main
Only three band raster are accepted. Channels should be the final dimension. Input tile has shape (15399, 14775, 4). Check for transparent alpha channel and remove if present
Here we get some error messages saying that the input raster image has four bands. This is pretty common for data that was exported from tools that create orthomosaics, like AgiSoft and Pix4d. Most programs have a toggle button for turning of the ‘alpha channel’. We can use rasterio to open up the image and just select the bands we want.
[ ]:
m = main.deepforest()
m.load_model("weecology/deepforest-tree")
# Make into a 3 page, remove alpha channel, and make channels last
r = rio.open("/Users/benweinstein/Downloads/Plot13Ortho.tif").read()
r = r[:3, :, :]
r = r.transpose(1, 2, 0)

# boxes = m.predict_tile(image=r, patch_size=700, patch_overlap=0.2, iou_threshold=0.5)
Reading config file: /Users/benweinstein/.conda/envs/test/lib/python3.10/site-packages/deepforest/data/deepforest_config.yml
GPU available: False, used: False
TPU available: False, using: 0 TPU cores
HPU available: False, using: 0 HPUs
Model saved to: /Users/benweinstein/.conda/envs/test/lib/python3.10/site-packages/deepforest/data/NEON.pt
Loading pre-built model: main
Its starts to run, but wow that’s going to take too long on CPU for me to write this post. On GPU this might only take 2mins, but with a CPU almost an hour according to progress bar. Kill that and let’s come back to the full prediction set when we are happy.
Crop a small portion to work with#
[ ]:
m = main.deepforest()
m.load_model("weecology/deepforest-tree")
# Make into a 3 page, remove alpha channel, and make channels last
r = rio.open("/Users/benweinstein/Downloads/Plot13Ortho.tif").read()
r = r[:3, :, :]
r = r.transpose(1, 2, 0)
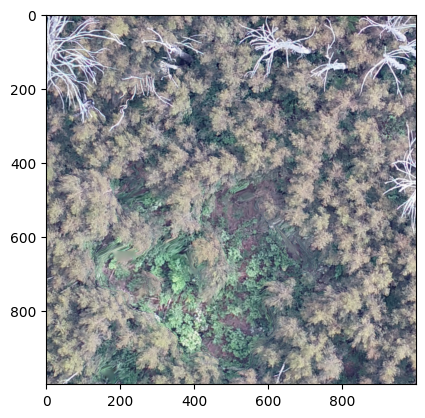
# Grab a portion of image just to test, near the middle
r = r[12000:13000, 6000:7000, :]
plt.imshow(r)
plt.show()
# save the image as numpy array
cv2.imwrite("/Users/benweinstein/Downloads/Plot13Ortho_crop.tif", r)
print(m.config)
boxes = m.predict_tile(image=r, patch_size=700, patch_overlap=0.2, iou_threshold=0.5)
boxes["image_path"] = "Plot13Ortho_crop.tif"
gdf = utilities.image_to_geo_coordinates(
boxes, root_dir="/Users/benweinstein/Downloads", flip_y_axis=True
)
gdf.to_file("/Users/benweinstein/Downloads/Plot13Ortho_crop.shp")
plot = visualize.plot_results(results=boxes, image=r)
plt.imshow(plot)
plt.show()
Reading config file: /Users/benweinstein/.conda/envs/test/lib/python3.12/site-packages/deepforest/data/deepforest_config.yml
GPU available: False, used: False
TPU available: False, using: 0 TPU cores
IPU available: False, using: 0 IPUs
HPU available: False, using: 0 HPUs
No validation file provided. Turning off validation loop
Model from DeepForest release https://github.com/weecology/DeepForest/releases/tag/1.0.0 was already downloaded. Loading model from file.
Loading pre-built model: https://github.com/weecology/DeepForest/releases/tag/1.0.0
/Users/benweinstein/.conda/envs/test/lib/python3.12/site-packages/pytorch_lightning/trainer/connectors/data_connector.py:436: Consider setting `persistent_workers=True` in 'predict_dataloader' to speed up the dataloader worker initialization.
Predicting DataLoader 0: 100%|██████████| 4/4 [00:05<00:00,  0.74it/s]
215 predictions in overlapping windows, applying non-max supression
129 predictions kept after non-max suppression
/Users/benweinstein/.conda/envs/test/lib/python3.12/site-packages/deepforest/utilities.py:394: UserWarning: flip_y_axis is True, and projected is True. In most cases, projected should be False when inverting y axis. Setting projected=False
  warnings.warn(
/Users/benweinstein/.conda/envs/test/lib/python3.12/site-packages/rasterio/__init__.py:304: NotGeoreferencedWarning: Dataset has no geotransform, gcps, or rpcs. The identity matrix will be returned.
  dataset = DatasetReader(path, driver=driver, sharing=sharing, **kwargs)
/Users/benweinstein/.conda/envs/test/lib/python3.12/site-packages/deepforest/visualize.py:126: UserWarning: No color was provided and the label column is not numeric. Using a single default color.
  warnings.warn("No color was provided and the label column is not numeric. "
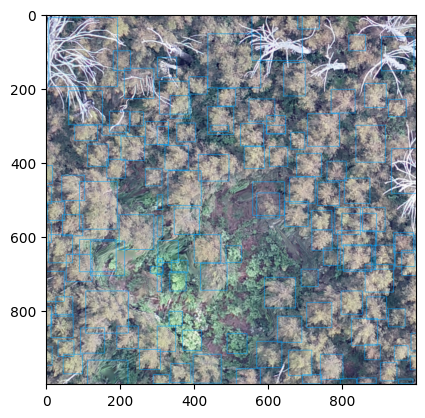
This is a decent start for zero-shot imagery in a new resolutions. Let’s try a couple things. To see if we can make it any better without new annotations. We always say that DeepForest is best used as a backbone, and an hour of new annotation on target imagery and gentle finetuning will produce better results than changing. hyperparameters.
Make geospatial predictions on the full tile#
Now that i’m happy with a small crop, I want to make predictions on the entire image. This will take some time. We can do away with the cropping of the image, as well as flipping the y axis, since the coordinates are now in the geospatial projection of the tile.
[ ]:
m = main.deepforest()
m.load_model("weecology/deepforest-tree")
# Make into a 3 page, remove alpha channel, and make channels last
r = rio.open("/Users/benweinstein/Downloads/Plot13Ortho.tif").read()
r = r[:3, :, :]
r = r.transpose(1, 2, 0)

# boxes = m.predict_tile(image=r, patch_size=700, patch_overlap=0.2, iou_threshold=0.5)
# boxes["image_path"] = "Plot13Ortho.tif"
# gdf = utilities.boxes_to_shapefile(boxes, root_dir="/Users/benweinstein/Downloads")
# gdf.to_file("/Users/benweinstein/Downloads/Plot13Ortho.shp")
Reading config file: /Users/benweinstein/.conda/envs/test/lib/python3.12/site-packages/deepforest/data/deepforest_config.yml
No validation file provided. Turning off validation loop
GPU available: False, used: False
TPU available: False, using: 0 TPU cores
IPU available: False, using: 0 IPUs
HPU available: False, using: 0 HPUs
/Users/benweinstein/.conda/envs/test/lib/python3.12/site-packages/pytorch_lightning/trainer/connectors/logger_connector/logger_connector.py:67: Starting from v1.9.0, `tensorboardX` has been removed as a dependency of the `pytorch_lightning` package, due to potential conflicts with other packages in the ML ecosystem. For this reason, `logger=True` will use `CSVLogger` as the default logger, unless the `tensorboard` or `tensorboardX` packages are found. Please `pip install lightning[extra]` or one of them to enable TensorBoard support by default
Model from DeepForest release https://github.com/weecology/DeepForest/releases/tag/1.0.0 was already downloaded. Loading model from file.
Loading pre-built model: https://github.com/weecology/DeepForest/releases/tag/1.0.0
---------------------------------------------------------------------------
CPLE_OpenFailedError                      Traceback (most recent call last)
File rasterio/_base.pyx:310, in rasterio._base.DatasetBase.__init__()

File rasterio/_base.pyx:221, in rasterio._base.open_dataset()

File rasterio/_err.pyx:221, in rasterio._err.exc_wrap_pointer()

CPLE_OpenFailedError: /Users/benweinstein/Downloads/Plot13Ortho.tif: No such file or directory

During handling of the above exception, another exception occurred:

RasterioIOError                           Traceback (most recent call last)
Cell In[1], line 11
      9 m.use_release()
     10 # Make into a 3 page, remove alpha channel, and make channels last
---> 11 r = rio.open("/Users/benweinstein/Downloads/Plot13Ortho.tif").read()
     12 r = r[:3,:,:]
     13 r = r.transpose(1,2,0)

File ~/.conda/envs/test/lib/python3.12/site-packages/rasterio/env.py:451, in ensure_env_with_credentials.<locals>.wrapper(*args, **kwds)
    448     session = DummySession()
    450 with env_ctor(session=session):
--> 451     return f(*args, **kwds)

File ~/.conda/envs/test/lib/python3.12/site-packages/rasterio/__init__.py:304, in open(fp, mode, driver, width, height, count, crs, transform, dtype, nodata, sharing, **kwargs)
    301 path = _parse_path(raw_dataset_path)
    303 if mode == "r":
--> 304     dataset = DatasetReader(path, driver=driver, sharing=sharing, **kwargs)
    305 elif mode == "r+":
    306     dataset = get_writer_for_path(path, driver=driver)(
    307         path, mode, driver=driver, sharing=sharing, **kwargs
    308     )

File rasterio/_base.pyx:312, in rasterio._base.DatasetBase.__init__()

RasterioIOError: /Users/benweinstein/Downloads/Plot13Ortho.tif: No such file or directory
In general I would look at this in QGIS, its much easier to zoom. Just for the sake of showing how its done, we can overlay the geospatial predicts on the large image
[ ]:
# View geopandas overlayed on image
fig, ax = plt.subplots(1, 1, figsize=(10, 10))

# transpose to channels first and then plot
show(np.rollaxis(r, 0, 3), ax=ax)
gdf.plot(ax=ax, color="red", alpha=0.5)
Traceback (most recent call last):
  File "/Users/benweinstein/.conda/envs/test/lib/python3.12/site-packages/debugpy/_vendored/pydevd/_pydevd_bundle/pydevd_frame.py", line 430, in _handle_exception
    self.do_wait_suspend(thread, frame, event, arg, exception_type=exception_type)
  File "/Users/benweinstein/.conda/envs/test/lib/python3.12/site-packages/debugpy/_vendored/pydevd/_pydevd_bundle/pydevd_frame.py", line 165, in do_wait_suspend
    self._args[0].do_wait_suspend(*args, **kwargs)
  File "/Users/benweinstein/.conda/envs/test/lib/python3.12/site-packages/debugpy/_vendored/pydevd/pydevd.py", line 2070, in do_wait_suspend
    keep_suspended = self._do_wait_suspend(thread, frame, event, arg, suspend_type, from_this_thread, frames_tracker)
                     ^^^^^^^^^^^^^^^^^^^^^^^^^^^^^^^^^^^^^^^^^^^^^^^^^^^^^^^^^^^^^^^^^^^^^^^^^^^^^^^^^^^^^^^^^^^^^^^^
  File "/Users/benweinstein/.conda/envs/test/lib/python3.12/site-packages/debugpy/_vendored/pydevd/pydevd.py", line 2106, in _do_wait_suspend
    time.sleep(0.01)
KeyboardInterrupt
---------------------------------------------------------------------------
TypeError                                 Traceback (most recent call last)
Cell In[6], line 4
      2 fig,ax = plt.subplots(1,1,figsize=(10,10))
      3 from rasterio.plot import show
----> 4 show(r, ax=ax)
      5 gdf.plot(ax=ax, color="red", alpha=0.5)

File ~/.conda/envs/test/lib/python3.12/site-packages/rasterio/plot.py:160, in show(source, with_bounds, contour, contour_label_kws, ax, title, transform, adjust, **kwargs)
    158         ax.clabel(C, **contour_label_kws)
    159 else:
--> 160     ax.imshow(arr, **kwargs)
    162 if title:
    163     ax.set_title(title, fontweight='bold')

File ~/.conda/envs/test/lib/python3.12/site-packages/matplotlib/__init__.py:1465, in _preprocess_data.<locals>.inner(ax, data, *args, **kwargs)
   1462 @functools.wraps(func)
   1463 def inner(ax, *args, data=None, **kwargs):
   1464     if data is None:
-> 1465         return func(ax, *map(sanitize_sequence, args), **kwargs)
   1467     bound = new_sig.bind(ax, *args, **kwargs)
   1468     auto_label = (bound.arguments.get(label_namer)
   1469                   or bound.kwargs.get(label_namer))

File ~/.conda/envs/test/lib/python3.12/site-packages/matplotlib/axes/_axes.py:5756, in Axes.imshow(self, X, cmap, norm, aspect, interpolation, alpha, vmin, vmax, origin, extent, interpolation_stage, filternorm, filterrad, resample, url, **kwargs)
   5753 if aspect is not None:
   5754     self.set_aspect(aspect)
-> 5756 im.set_data(X)
   5757 im.set_alpha(alpha)
   5758 if im.get_clip_path() is None:
   5759     # image does not already have clipping set, clip to axes patch

File ~/.conda/envs/test/lib/python3.12/site-packages/matplotlib/image.py:723, in _ImageBase.set_data(self, A)
    721 if isinstance(A, PIL.Image.Image):
    722     A = pil_to_array(A)  # Needed e.g. to apply png palette.
--> 723 self._A = self._normalize_image_array(A)
    724 self._imcache = None
    725 self.stale = True

File ~/.conda/envs/test/lib/python3.12/site-packages/matplotlib/image.py:693, in _ImageBase._normalize_image_array(A)
    691     A = A.squeeze(-1)  # If just (M, N, 1), assume scalar and apply colormap.
    692 if not (A.ndim == 2 or A.ndim == 3 and A.shape[-1] in [3, 4]):
--> 693     raise TypeError(f"Invalid shape {A.shape} for image data")
    694 if A.ndim == 3:
    695     # If the input data has values outside the valid range (after
    696     # normalisation), we issue a warning and then clip X to the bounds
    697     # - otherwise casting wraps extreme values, hiding outliers and
    698     # making reliable interpretation impossible.
    699     high = 255 if np.issubdtype(A.dtype, np.integer) else 1

TypeError: Invalid shape (14775, 3, 15399) for image data