Visualization#
To view the results of DeepForest models, we use Roboflow’s supervision library. Thanks to this team for making a nice set of tools. After making predictions, use :func:deepforest.visualize.plot_results.
Predict#
from deepforest import main, get_data
from deepforest.visualize import plot_results

model = main.deepforest()
model.load_model(model_name="weecology/deepforest-tree", revision="main")

sample_image_path = get_data("OSBS_029.png")
results = model.predict_image(path=sample_image_path)
plot_results(results)
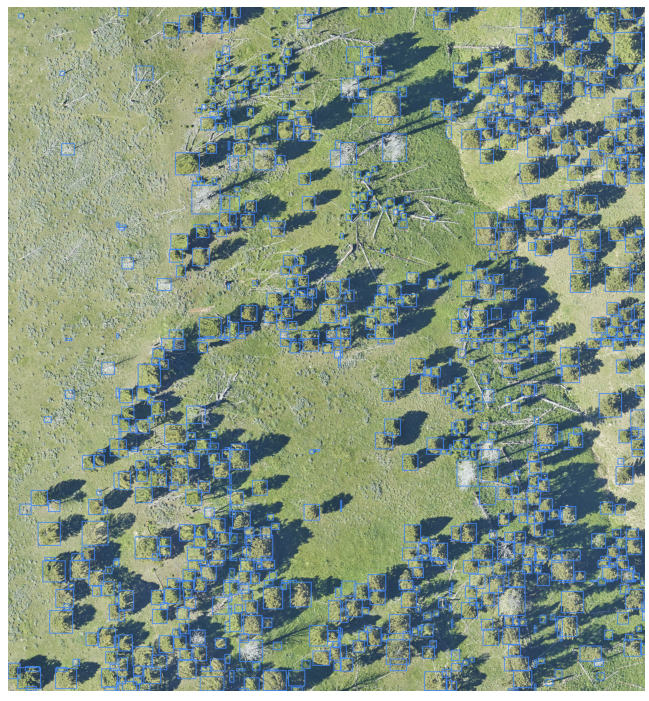
The same works with deepforest.main.predict_tile
import os

from deepforest import main, get_data
from deepforest.visualize import plot_results

model = main.deepforest()
model.load_model(model_name="weecology/deepforest-tree", revision="main")

img_path = get_data(path="2019_YELL_2_528000_4978000_image_crop2.png")
results = model.predict_tile(img_path, patch_overlap=0, patch_size=400)
plot_results(results)
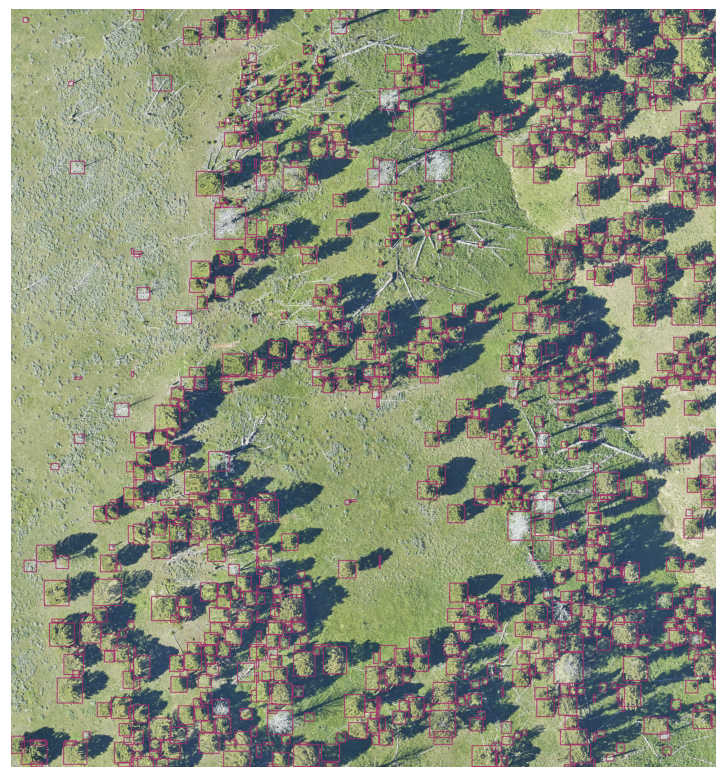
Customizing outputs#
The colors and thickness of annotations can be updated.
# Orange boxes and thicker lines
plot_results(results, results_color=[109,50,168], thickness=2)
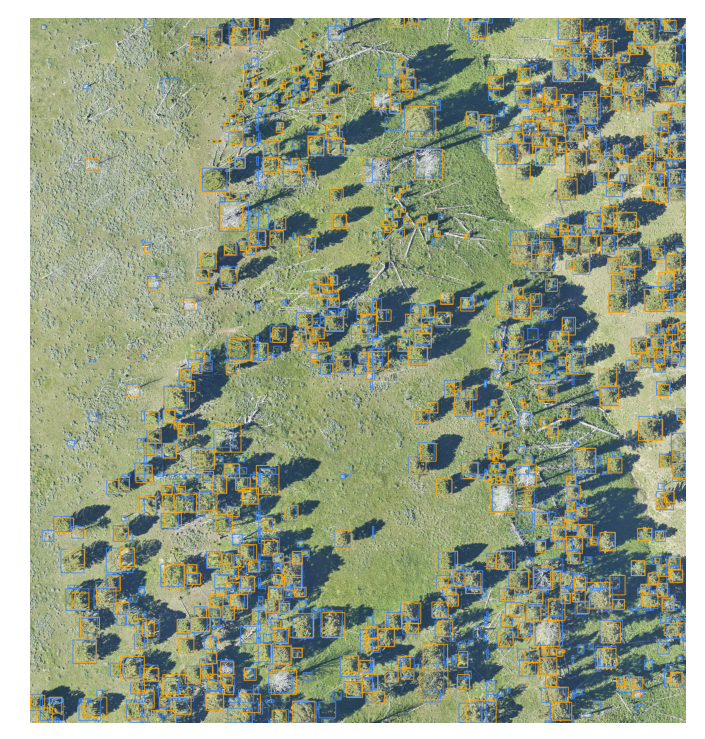
Overlaying predictions and ground truth#
from deepforest.utilities import read_file

ground_truth = read_file(get_data(path="2019_YELL_2_528000_4978000_image_crop2.xml"))
plot_results(results, ground_truth=ground_truth)
Multi-class visualization#
For results with more than one predicted class, the plot_results function will detect multiple classes and use a color palette instead of a single class. For control over the color palette see supervision.draw.color
from supervision.draw.color import ColorPalette
import supervision as sv

color_palette = sv.ColorPalette.from_matplotlib('viridis', 6)
plot_results(results, ground_truth=ground_truth, results_color=color_palette)